The flow duration curve is a plot of
- AFlow against its time of occurrence in chronological order.
- BFlow in ascending order against the percentage of time in chronological order.
- CFlow that equalled or exceeded against the percentage of time.Correct
- DFlow against the duration of time for which it is sustained.
Solution
Concept
Flow Duration Curve
Formula
No, a flow duration curve is a graphical representation of the frequency distribution of streamflow, but the percentage exceedance probability P for ranking flows is calculated as P = (m / (N + 1)) × 100, where m is the rank of the flow magnitude in descending order and N is the total number of records.
Step-by-step solution
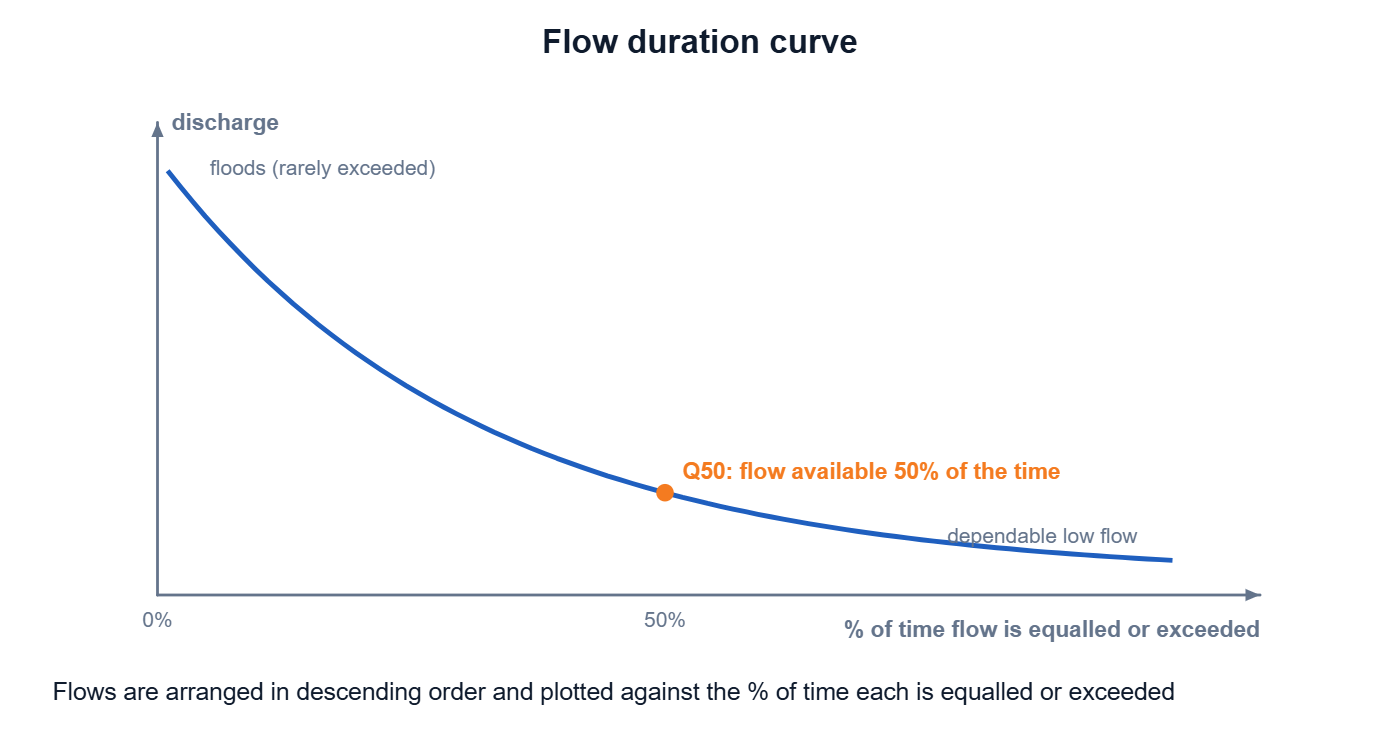
1. Understand that a Flow Duration Curve (FDC) shows the relationship between flow magnitude (discharge) and the percentage of time it is equaled or exceeded. 2. Arrange streamflow values in descending order to calculate the exceedance probability percentage for each flow rate. 3. Compare the definition with the given options to select Option C as the correct answer.
Explanation
A flow duration curve shows the percentage of time that a specific streamflow (river discharge) is equaled or exceeded during a given period. It helps in understanding the availability and variability of water flow in a river over time.
Shortcut
Remember "FDC = Flow vs % Exceedance": A Flow Duration Curve always plots Flow against the percentage of time it is Equalled or Exceeded.
Common mistake
Many students confuse the flow duration curve with a hydrograph and incorrectly select Option A (flow plotted against time in chronological order) instead of flow plotted against the percentage of time equaled or exceeded.
Correct answer: C) Flow that equalled or exceeded against the percentage of time.