Hyetograph represents
- ACumulative rainfall
- BInfiltration curve
- CRainfall intensity vs timeCorrect
- DRainfall frequency
Solution
Concept
A hyetograph plots rainfall intensity (y-axis) against time (x-axis), whereas a mass curve plots cumulative rainfall against time.
Formula
Rainfall Intensity (i) = Depth of Rainfall (P) / Time (t)
Step-by-step solution
1. Identify the variables involved in a hyetograph: Rainfall intensity and Time. 2. Recall that 'Hyeto' refers to rain and 'graph' refers to a plot. 3. Distinguish it from a mass curve, which represents cumulative rainfall. 4. Conclude that the plot of intensity vs. time is the correct definition.
Explanation
A hyetograph is a graphical representation of rainfall intensity over time, usually depicted as a bar chart. The area under the hyetograph represents the total depth of rainfall received during that period.
Why the other options are wrong
A: This is represented by a Mass Curve. B: This is represented by an Infiltration Capacity Curve (e.g., Horton's curve). D: This is related to Rainfall Frequency Analysis or Return Period, often shown via IDF (Intensity-Duration-Frequency) curves.
Shortcut
Remember: Hyetograph = Intensity vs Time; Mass Curve = Cumulative Rainfall vs Time.
Common mistake
Confusing the hyetograph with the mass curve (cumulative rainfall) or the hydrograph (discharge vs time).
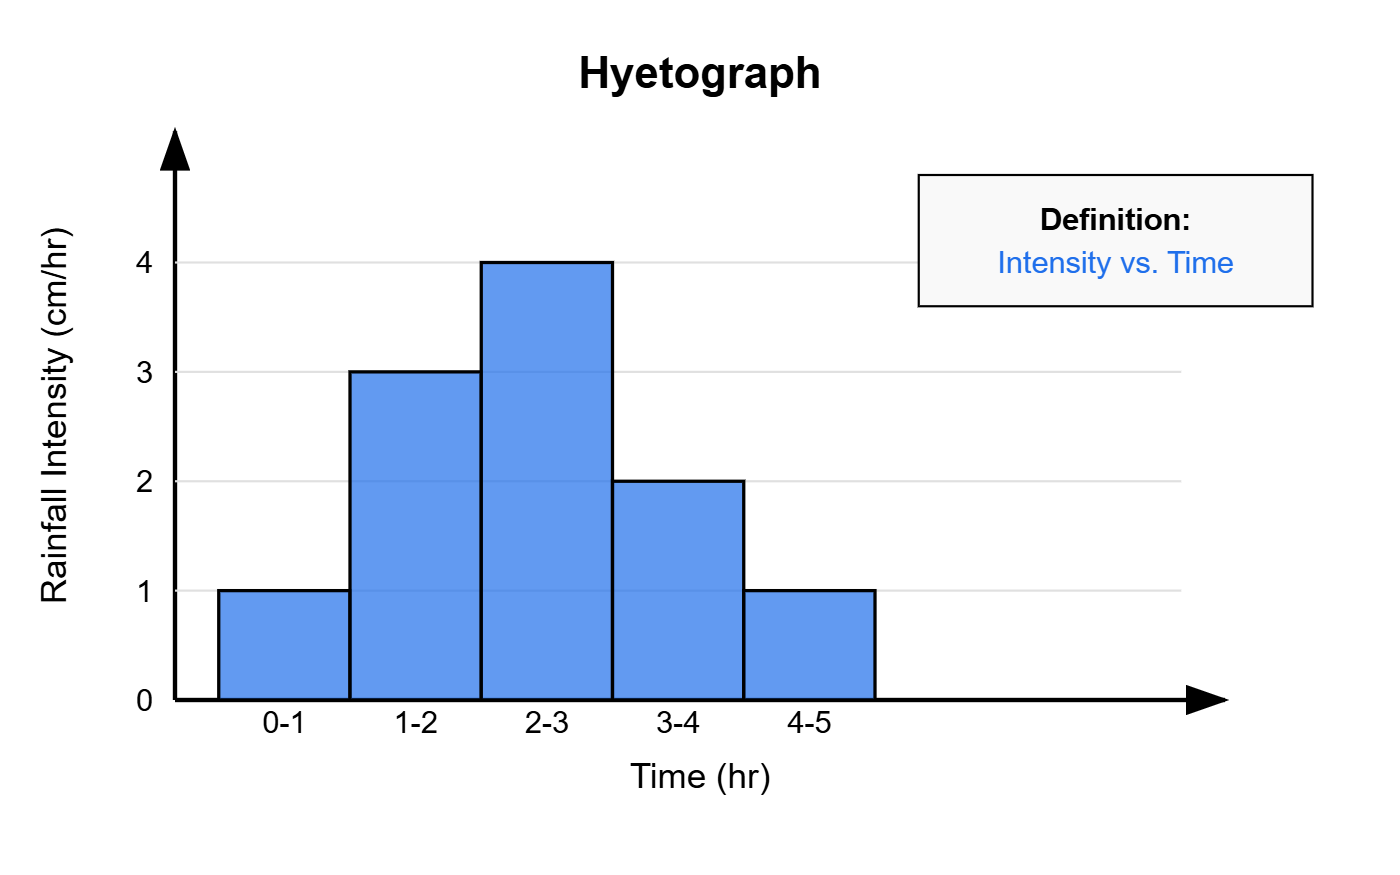
Correct answer: C) Rainfall intensity vs time