In a typical column interaction diagram, the x-axis usually represents
- AThe bending moment about the major axis of the column.Correct
- BThe bending moment about the minor axis of the column.
- CThe axial load on the column.
- DThe shear force in the column.
Solution
Concept
Representation of column interaction diagrams
Formula
NONE
Step-by-step solution
1. Column interaction diagrams plot the combination of axial load and bending moment capacity. 2. Standard interaction diagrams conventionally represent the bending moment on the x-axis and axial load on the y-axis. Answer: A
Explanation
In a standard column interaction diagram, the vertical y-axis plots the ultimate axial load capacity while the horizontal x-axis plots the bending moment capacity about the major principal axis. This graphical curve defines the envelope of acceptable combined axial load and moment combinations for safe structural design. Therefore, option A correctly identifies the quantity represented on the x-axis.
Why the other options are wrong
B) Minor axis bending moment is plotted on a separate diagram or 3D surface rather than the standard x-axis of a 2D diagram. C) The axial load on the column is traditionally represented on the y-axis of a column interaction diagram. D) Shear force is analyzed in shear design diagrams rather than column axial load-moment interaction diagrams.
Shortcut
Column P-M interaction diagram: Y-axis is Axial Load (P), X-axis is Bending Moment (M).
Common mistake
Assuming the x-axis represents the axial load rather than the bending moment and selecting option C.
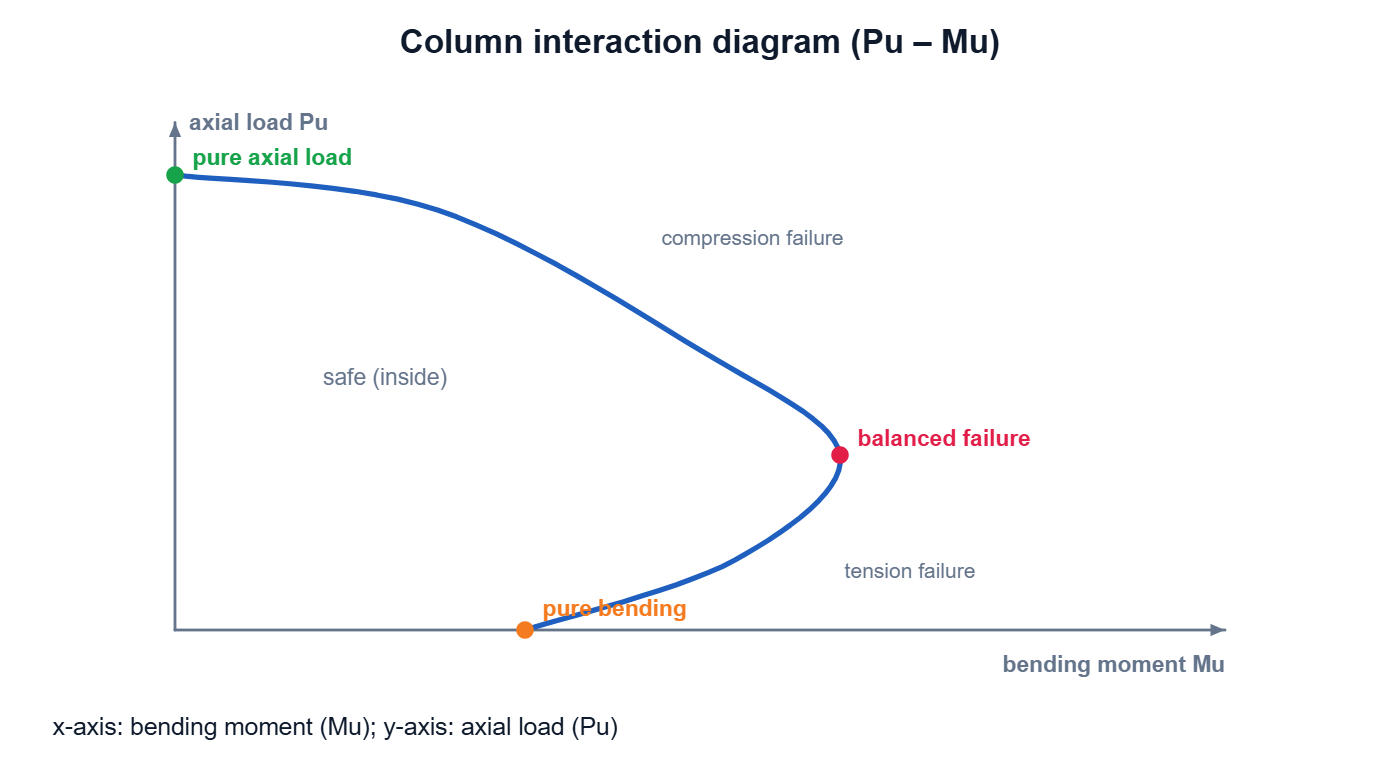
Correct answer: A) The bending moment about the major axis of the column.