What graphical tool is commonly used to represent the strength of a reinforced concrete (section) under combined axial load and bending moment?
- AStress-strain curve
- BInteraction diagramCorrect
- CMohr’s circle
- DStress block diagram
Solution
Concept
Interaction diagram for combined axial load and bending
Formula
NONE
Step-by-step solution
1. Combined axial load and bending moment acting on a reinforced concrete section creates a range of ultimate load-moment combinations. 2. An interaction diagram graphically plots the axial capacity versus bending moment capacity for a column section. 3. Therefore, an interaction diagram is the standard graphical tool used for this representation. Answer: B
Explanation
An interaction diagram plots the combined axial load capacity against the flexural strength for a reinforced concrete column section. It defines the boundary of all safe combinations of axial force and bending moment that the section can resist. Therefore, option B is correct.
Why the other options are wrong
A) A stress-strain curve illustrates material constitutive behavior rather than section strength under combined axial and bending loads. C) Mohr's circle is used to determine principal stresses and maximum shear stresses at a point rather than section capacity. D) A stress block diagram represents internal stress distribution across a cross-section during flexure, not combined strength envelope curves.
Shortcut
Axial load + Bending moment interaction = Interaction diagram.
Common mistake
Selecting a stress-strain curve or stress block diagram instead of the interaction diagram for combined axial load and bending moment.
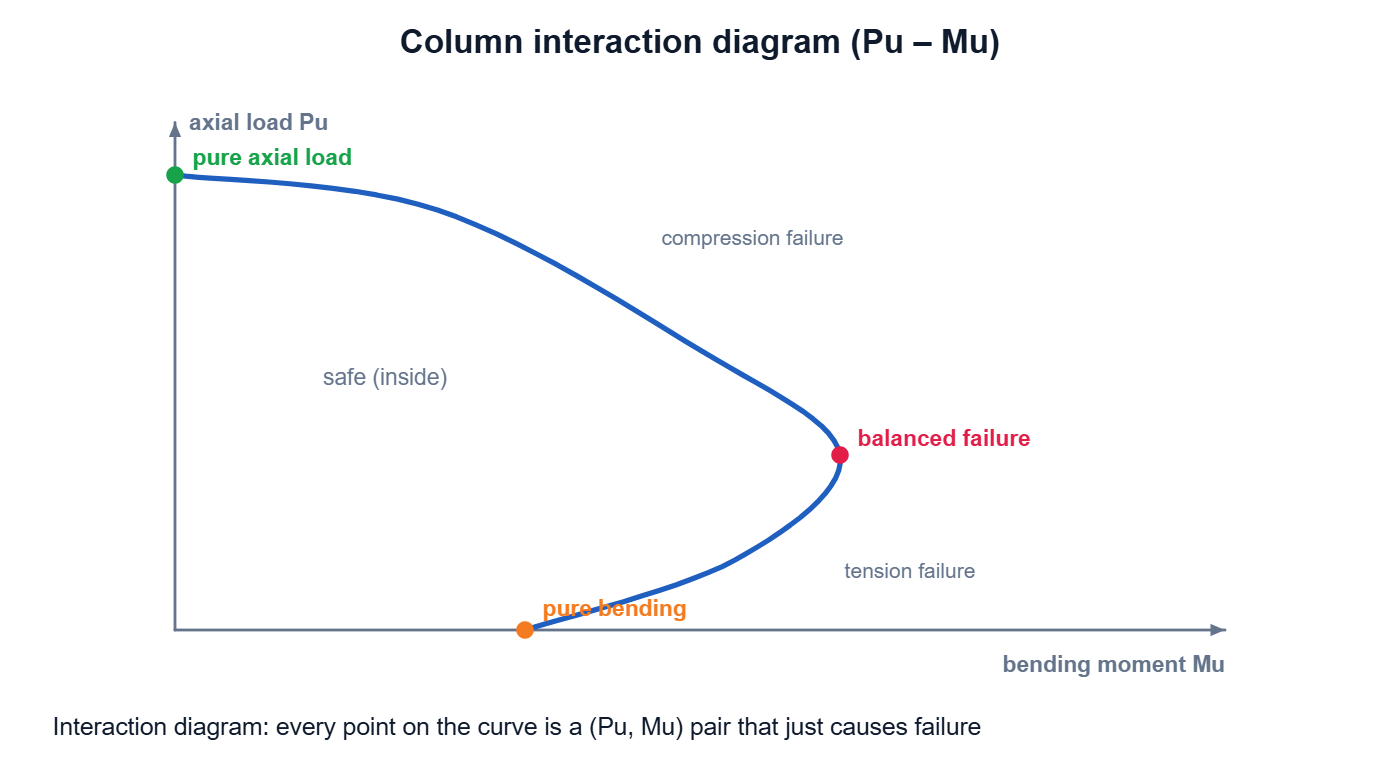
Correct answer: B) Interaction diagram