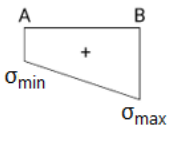
Which of the following stress distribution diagrams represents the condition where the intensity of direct stress is less than the intensity of bending stress? Where σmin is minimum resultant stress and σmax is maximum resultant stress.
- A
- B
 Correct
- C
- D
Solution
Concept
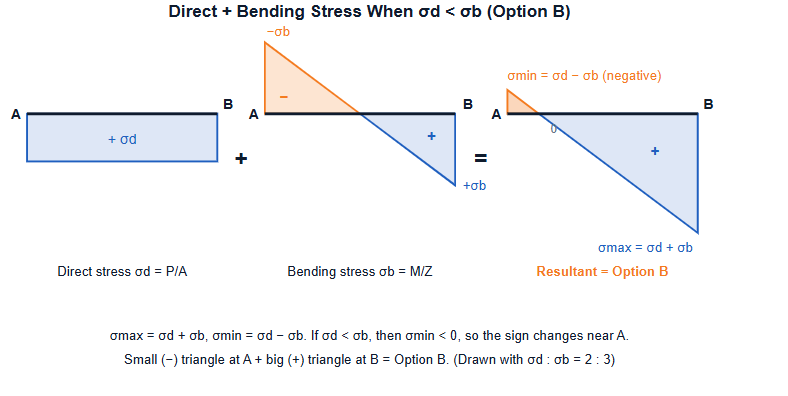
When bending stress is more than direct stress, the minimum resultant stress becomes negative, so there is stress reversal (tension) at one edge.
Formula
σmax = σd + σb ; σmin = σd − σb ; σd = P/A ; σb = M/Z
Step-by-step solution
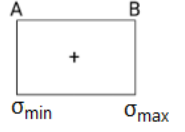
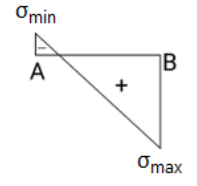
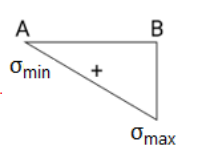
1. Resultant stress at the edges: σmax = σd + σb and σmin = σd − σb. 2. If σd < σb, then σmin is negative, so the diagram has opposite sign at one edge. 3. Image 1 (A): uniform rectangle, so σb = 0 (pure direct stress). 4. Image 2 (B): small negative triangle near A and large positive triangle near B, so σmin < 0. This means σd < σb. 5. Image 3 (C): triangle with zero stress at A, so σd = σb. 6. Image 4 (D): trapezoid with both ends positive, so σ
Correct answer: B)