Which one of the following statements is NOT correct according to Gantt chart?
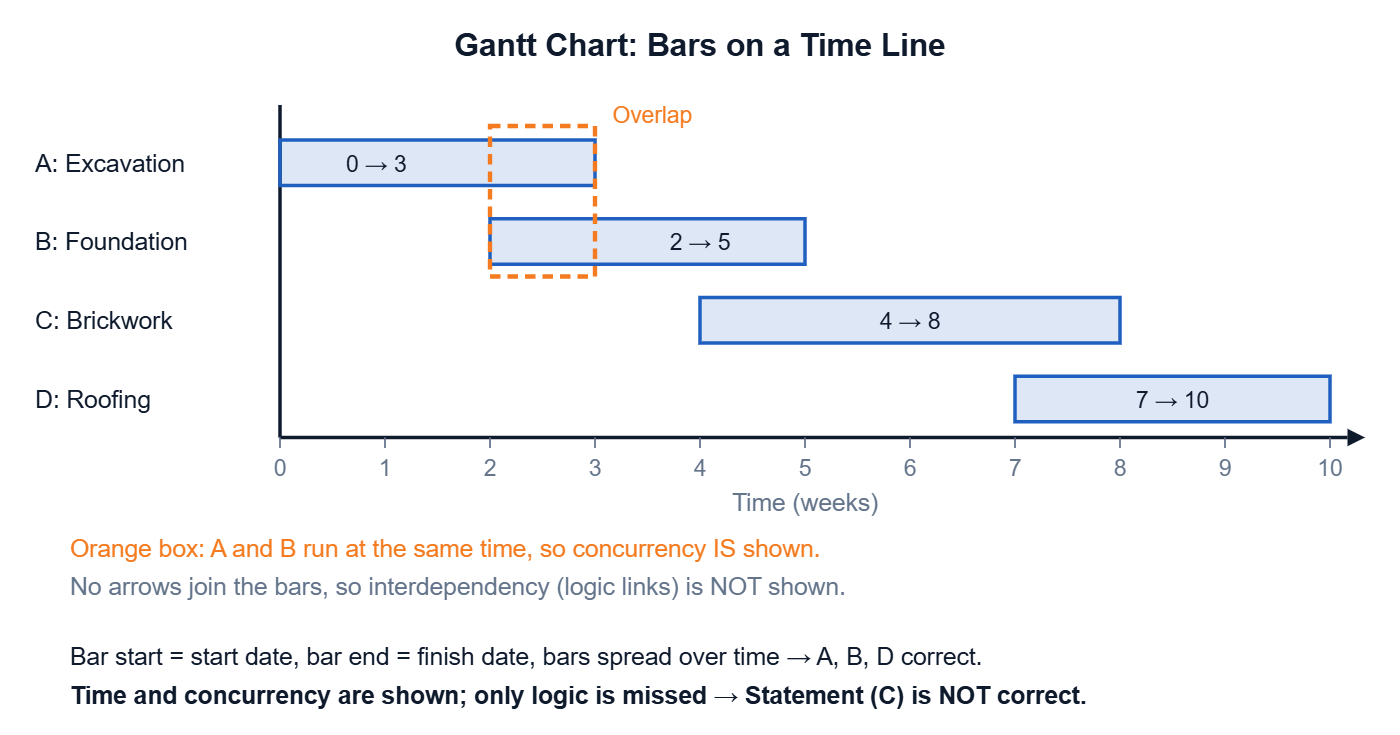
- AActivities are illustrated as bars on a horizontal time line.
- BBeginning and end of a bar coincides with the activity's starting and ending dates.
- CThe time and operational concurrency aspects of the schedule is missed in this chart.Correct
- DIllustrations are given that how the activities are to be distributed over the project time line.
Solution
Concept
A Gantt chart shows each activity as a bar on a time scale, so time and parallel (concurrent) work are clearly visible. Its main weakness is that it does not show dependencies between activities.
Step-by-step solution
1. A Gantt chart draws each activity as a horizontal bar on a time line, so A is correct. 2. The bar starts on the start date and ends on the finish date, so B is correct. 3. The bars show how the work is spread over the project time, so D is correct. 4. Bars placed one above another show which activities run at the same time. So time and concurrency are shown, not missed. 5. The real limitation is that it does not show interdependency (logic links) between activities. So C is NOT correct.
Explanation
A Gantt chart clearly shows the time of each activity and which activities run in parallel. What it misses is the logical link (dependency) between activities. So statement C is wrong.
Why the other options are wrong
A: Correct. Activities are bars on a horizontal time scale. B: Correct. The bar ends match the start and finish dates. D: Correct. The chart shows how activities are spread over the project time.
Shortcut
Gantt chart shows TIME well. It misses LOGIC (dependency). Any option saying it misses time is wrong.
Common mistake
Confusing 'missing interdependency' with 'missing time or concurrency'. The Gantt chart shows concurrency very clearly.
Correct answer: C) The time and operational concurrency aspects of the schedule is missed in this chart.